Census data for 2020 released in August show the slowest population growth for a decade in the archdiocese since 1980. Eight deaneries increased population; the North City Deanery and the North County Deanery did not. The number of people who identified as solely white or African-American declined; those who identified as “other races” increased, including Asian (50%), multi-racial (250%) and Hispanic (50%).
Why it’s important
This data will have a role in a major strategic planning effort that has begun in the Archdiocese of St. Louis. The planning effort, announced by Archbishop Mitchell Rozanski in July, will examine all parishes, schools and curia offices and agencies in the Archdiocese of St. Louis.
Archbishop Rozanski has said the planning process is expected to take place over the next two to three years, with many listening sessions and feedback from Catholics in the archdiocese. The plan, he said, will “ensure that your grandchildren are Catholic.”
The archbishop said the effort “will shape the footprint of our efforts in the future in very significant ways. This is something that I believe cannot wait and we must immediately seize the opportunity to radically change our approach as to how we evangelize and reach the people of this archdiocese. To effectively do this, we can leave no stone unturned. We must honestly assess our ministry, our structures, our approach and our effectiveness.”
________________________________________________________
Total population figures
1970 1,933,811
1980 1,918,144 ‐0.8%
1990 2,005,499 4.6%
2000 2,118,721 5.6%
2010 2,211,707 4.4%
2020 2,265,363 2.4%
________________________________________________________
Parish boundaries
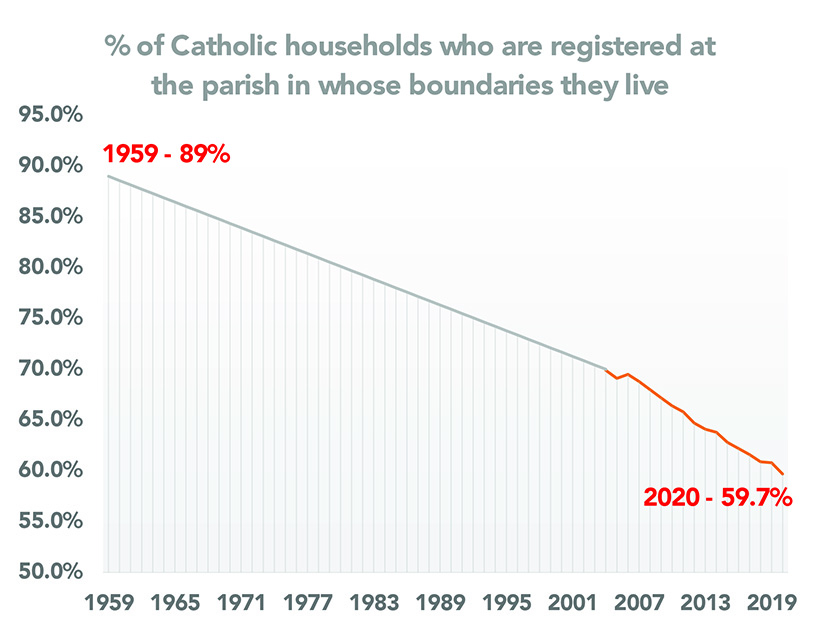
Most parishes in the Archdiocese are are defined by territory, with distinctive boundaries. In the past, most Catholics would live within the boundaries of the parish they attend, but data covering the past 17 years shows a continuing trend of Catholic households registering in the parish of their choosing, rather than in the boundaries where they live. In 2020, 59.7% of all Catholic households in the archdiocese were registered in the parish territory in which they lived.
There are several reasons for this, including the location of the parish within its boundaries (if it is on the far edge of the territory, for example); Catholics who who move to a new house outside of the boundaries, but remain members of the original parish; whether a parish has a school connected to it; and Catholics who are members of personal parishes (Latin Mass, parishes that have Masses in other languages, etc.)
Total archdiocese
Percent of Parishioner Households that are in the boundaries of the parish 60.5%
Percent of Catholic Households in the boundaries that are parishioners 58.8%
Average of the two columns 59.7%
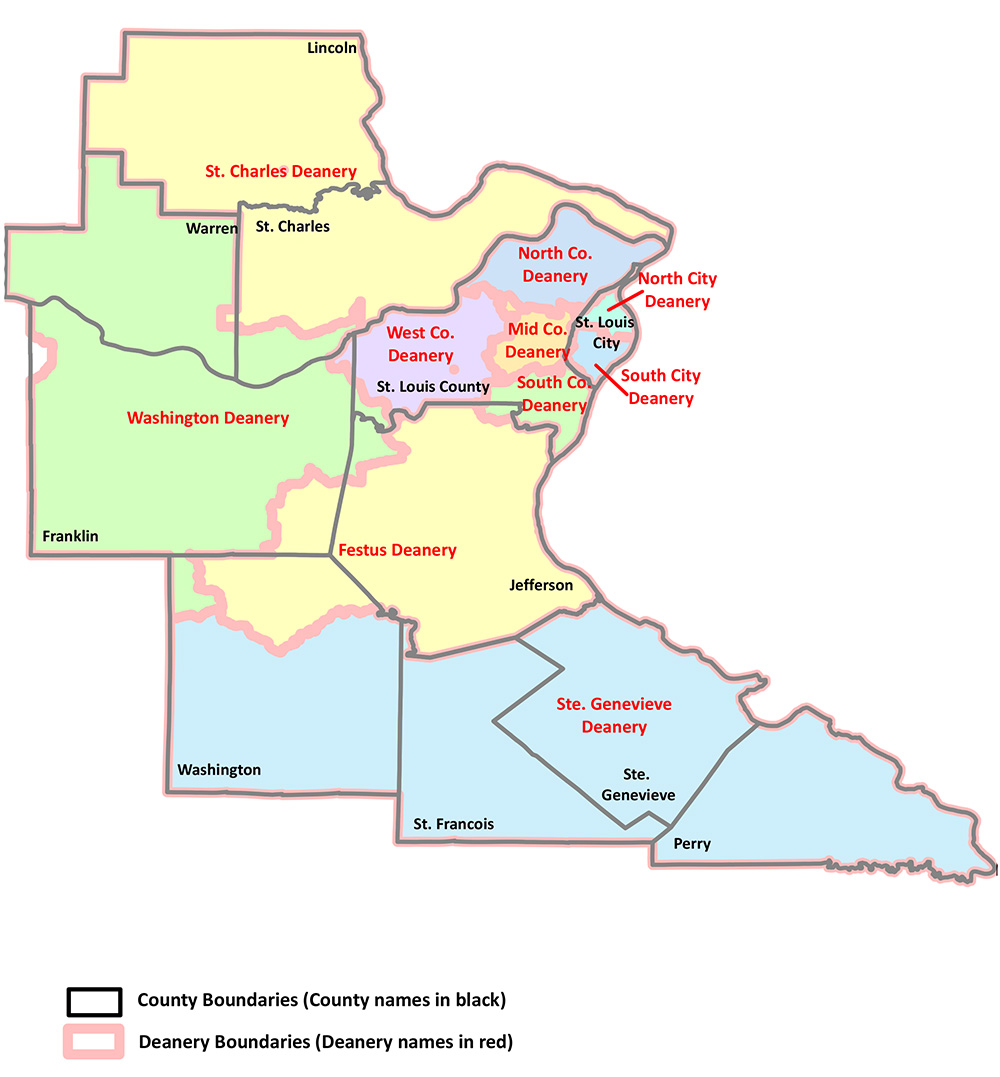
| Festus Deanery |
|---|
| 2010 population: 205,795 | 2020 population: 213,226 | Change: 7,431 | Percent change: 3.6% | in boundaries: 67.0%* | % parishioners: 61.2%** |
| Mid county Deanery |
|---|
| 2010 population: 204,698 | 2020 population: 213,915 | Change: 9,217 | Percent change: 4.5% | in boundaries: 59.5%* | % parishioners: 58.%** |
| North City Deanery |
|---|
| 2010 population: 113,819 | 2020 population: 93,804 | Change: ‐20,015 | Percent change: ‐17.6% | in boundaries: 10.8%* | % parishioners: 36.5%** |
| North County Deanery |
|---|
| 2010 population: 339,864 | 2020 population: 323,766 | Change: ‐16,098 | Percent change: ‐4.7% | in boundaries: 63.9%* | % parishioners: 55.3%** |
| South City Deanery |
|---|
| 2010 population: 201,630 | 2020 population: 203,115 | Change: 1,485 | Percent change: 0.7% | in boundaries: 57.3%* | % parishioners: 53.0%** |
| South county Deanery | |
|---|
| 2010 population: 205,555 | 2020 population: 210,813 | Change: 5,259 | Percent change: 2.6% | in boundaries: 60.7%* | % parishioners: 59.5%** |
| St. Charles Deanery |
|---|
| 2010 population: 412,358 | 2020 population: 464,198 | Change: 51,840 | Percent change: 12.6% | in boundaries: 56.2%* | % parishioners: 55.4%** |
| Ste. Genevieve Deanery |
|---|
| 2010 population: 124,581 | 2020 population: 124,974 | Change: 393 | Percent change: 0.3% | in boundaries: 76.5%* | % parishioners: 79.0%** |
| Washington Deanery |
|---|
| 2010 population: 135,997 | 2020 population: 141,817 | Change: 5,820 | Percent change: 4.3% | in boundaries: 69.6%* | % parishioners: 65.9%** |
| West county Deanery |
|---|
| 2010 population: 267,411 | 2020 population: 275,736 | Change: 8,325 | Percent change: 3.1% | in boundaries: 62.5%* | % parishioners: 60.7%** |